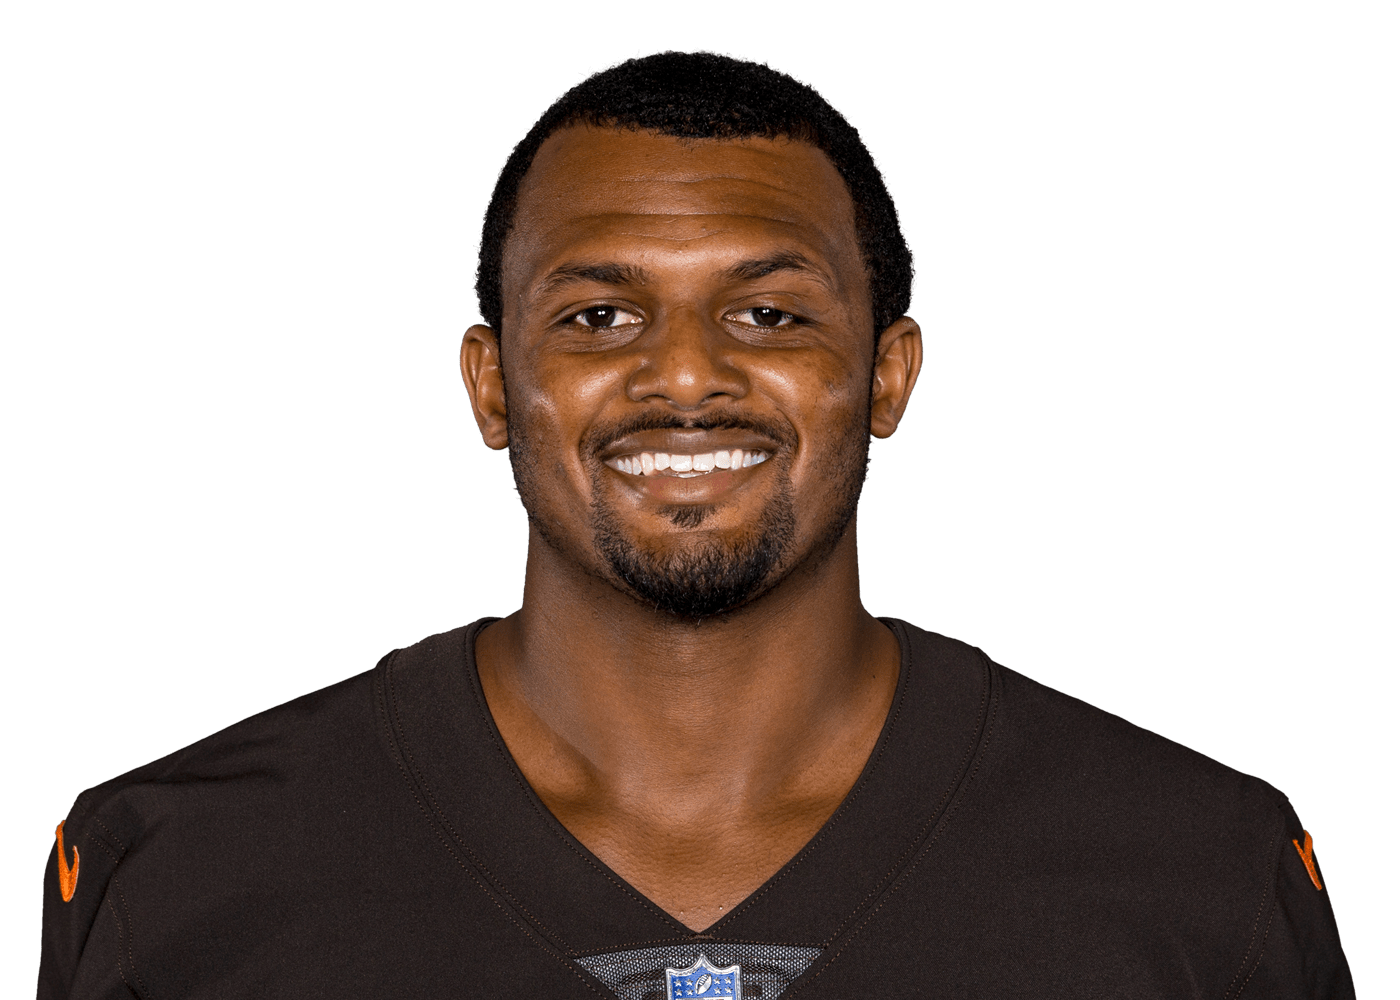
2026 · WEEK 5 CLOSE
$0–1W−100%SINCE '26 DRAFTHIGH $61
AGE22Mar 15, 2004
EXP1 yrsince 2025
HEIGHT5'11"
inherits 3% of CLE targets (55% vacated, his claim 6%)
Bond (concussion) has cleared protocol and is practicing Monday, Scott Petrak of the Elyria Chronicle-Telegram reports.
Bond was concussed in Cleveland's second preseason game and was nearing 100 percent at the end of August. He's expected to fill the WR4 role for the Browns behind KC Concepcion, Denzel Boston and veteran Jerry Jeudy. As a rookie last season, Bond caught just 18 of 44 targets for 338 yards and zero touchdowns as a deep threat.
Bond (concussion) is not practicing Monday, Scott Petrak of the Elyria Chronicle-Telegram reports.
Bond continues to deal with the concussion he sustained in Cleveland's second preseason game, but coach Todd Monken said Monday the wideout is nearing a return to the field. Bond is expected to open the season as a sub-package wide receiver behind Jerry Jeudy and rookies KC Concepcion and Denzel Boston while also handling return duties. Bond doesn't carry much fantasy value outside of return yardage leagues.
Bond is seemingly in better position to secure a spot on the Browns' 53-man roster following the release of Cedric Tillman on Thursday, as reported by ESPN.com.
The Texas product had his moments last season as an undrafted rookie, recording 18 receptions for 338 yards on 44 targets over 16 regular-season games. Bond, like his fellow Browns pass catchers, dealt with uneven quarterback play throughout the campaign, but his big-play ability -- he recorded six receptions of 20-plus yards, including three of 40-plus -- and overall upside likely made him a more attractive option than Tillman for a potential No. 4 receiver role.
Everyone sharing the ball with Isaiah, most valuable first.
Above the line the plan was to throw; below it, to run.
Bond cleared concussion protocol during Saturday's preseason game against the Bills.
Subscribe now to instantly reveal our take on this news.
Bond is being evaluated for a possible concussion and is questionable to return to Saturday's preseason game against the Bills.
Subscribe now to instantly reveal our take on this news.
Bond added 15 pounds of muscle during the offseason and was one of the Browns' standout performers during spring practices, Daniel Oyefusi of ESPN.com reports.
Subscribe now to instantly reveal our take on this news.
Bond caught one of two targets for 13 yards and had one carry for four yards in Sunday's 20-18 win over Cincinnati in Week 18.
Subscribe now to instantly reveal our take on this news.
Bond secured his lone target for 16 yards in Sunday's 13-6 win over Pittsburgh in Week 17.
Subscribe now to instantly reveal our take on this news.
The WRs priced immediately above and below him.