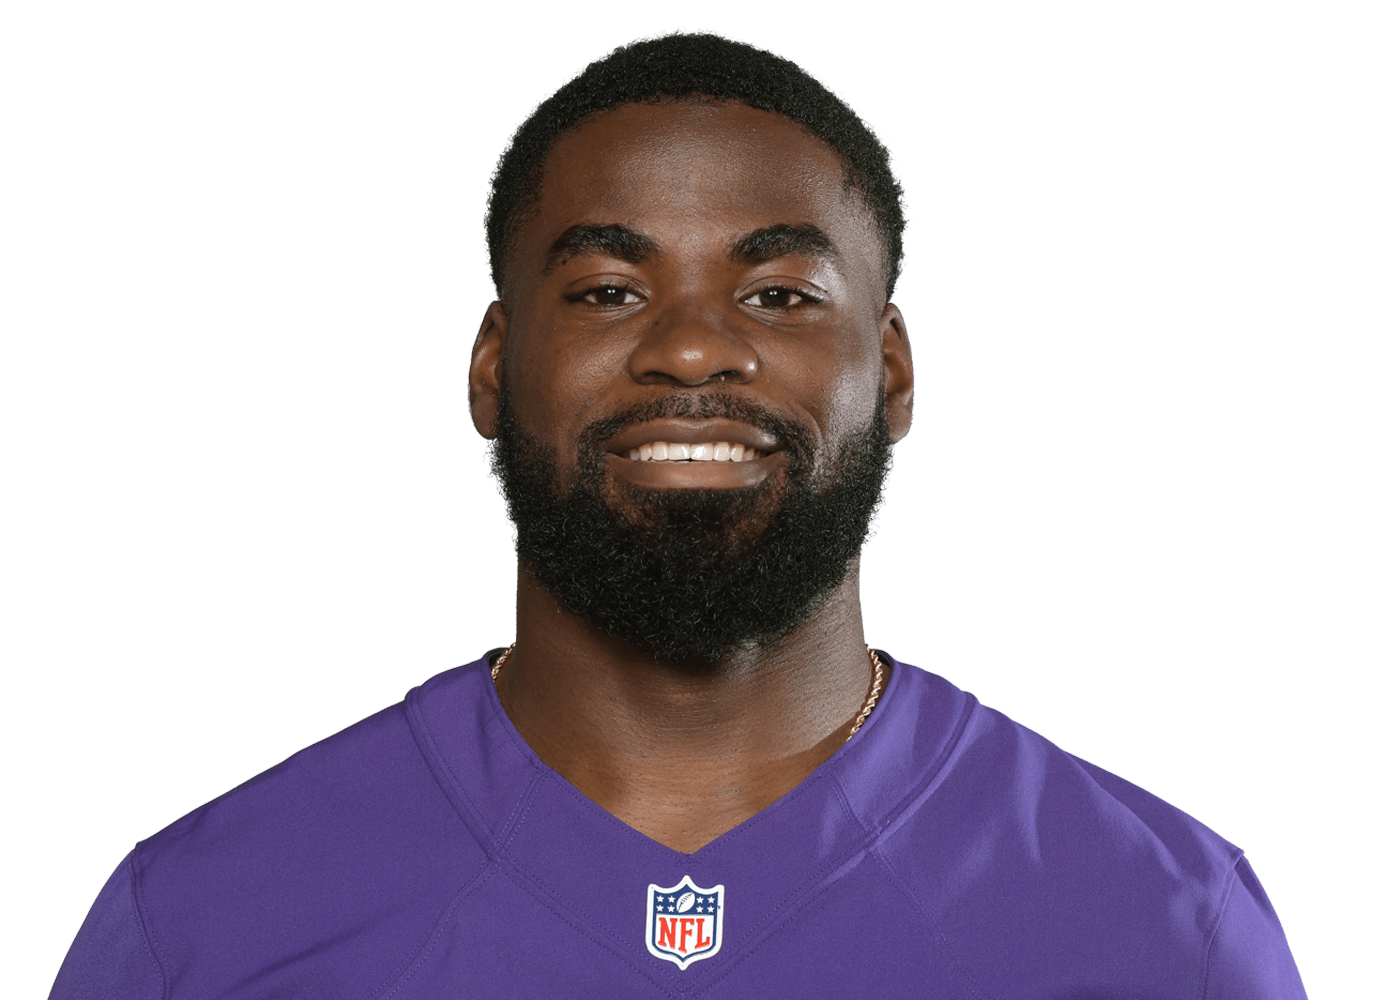
2021 · WEEK 17 CLOSE
$2,977−25.6%1W+163%SINCE '21 DRAFTHIGH $5,185
AGE24Jun 4, 1997
EXP2 yrssince 2019
HEIGHT5'9"
No 2021 projection is stored.
Historical projections may have been pruned after their prices were published.
No 2021 games yet.
Usage trends appear after week 1.
No 2021 games yet.
This fills in after week 1.
No 2021 stats yet.
The table fills in after the first regular-season game.
No 2021 games yet.
Floor and ceiling need a few games.
No 2021 games yet.
Splits appear after week 1.
No 2021 games yet.
Brown (ankle) was a limited participant at the Eagles' practice Wednesday.
Brown has been sidelined for each of the team's last three contests while nursing an ankle injury, but his limited session Wednesday is a step in the right direction. The wide receiver will have two more chances to log a full practice and officially move past the ankle issue prior to Sunday's matchup with the Panthers.
Brown (ankle) has been ruled out for Sunday's game against the Jaguars.
Subscribe now to instantly reveal our take on this news.
Brown (ankle) did not practice Wednesday.
Subscribe now to instantly reveal our take on this news.
Everyone sharing the ball with Marquise, most valuable first.
No 2021 games yet.
The log fills in after each week's games.
Above the line the plan was to throw; below it, to run.
No 2021 games yet.
The position map fills in after week 1.
Brown (ankle) is listed as out ahead of Sunday's game against the Rams.
Subscribe now to instantly reveal our take on this news.
Brown (ankle) did not participate in practice Thursday, Olivia Reiner of The Philadelphia Inquirer reports.
Subscribe now to instantly reveal our take on this news.
Brown (ankle) did not participate in Wednesday's practice.
Subscribe now to instantly reveal our take on this news.
Brown (ankle) has been ruled out ahead of Monday's game against the Bears.
Subscribe now to instantly reveal our take on this news.
Brown (ankle) did not participate in Friday's practice.
Subscribe now to instantly reveal our take on this news.
Brown was active but did not play in the Eagles' 24-22 win over the Commanders on Sunday.
Subscribe now to instantly reveal our take on this news.
Brown brought in his only target for a four-yard reception in the Eagles' 24-7 preseason loss to the Ravens on Saturday.
Subscribe now to instantly reveal our take on this news.
Brown enters training camp competing for a role in Philadelphia's wide receiver rotation following the team's trade of A.J. Brown to the Patriots, Glenn Erby of USA Today reports.
Subscribe now to instantly reveal our take on this news.
Brown, who signed with the Eagles in March and is thought to have the inside track to the No. 3 receiver job, gained competition for the role Friday in the form of trade acquisition Dontayvion Wicks, Rob Demovsky and Adam Schefter of ESPN report.
Brown certainly has the more accomplished resume between him and Wicks, but the latter is four years younger and the Eagles saw fit to invest two draft picks to acquire him from the Packers before also signing him to a one-year, $12.5 million extension. Wicks did have trouble with drops over his first three seasons in Green Bay, while Brown has greatly improved in that area compared to earlier in his career, but it's conceivable Wicks makes a strong play for Brown's snaps in training camp and preseason.
Brown is slated to sign a one-year contract with Philadelphia, NFL reporter Jordan Schultz reports.
Subscribe now to instantly reveal our take on this news.
Brown gathered in three of six targets for 64 yards during Sunday's 14-12 loss to the Raiders.
Subscribe now to instantly reveal our take on this news.
Brown brought in one of three targets for seven yards in the Chiefs' 20-13 loss to the Broncos on Thursday night.
Subscribe now to instantly reveal our take on this news.
The WRs priced immediately above and below him.